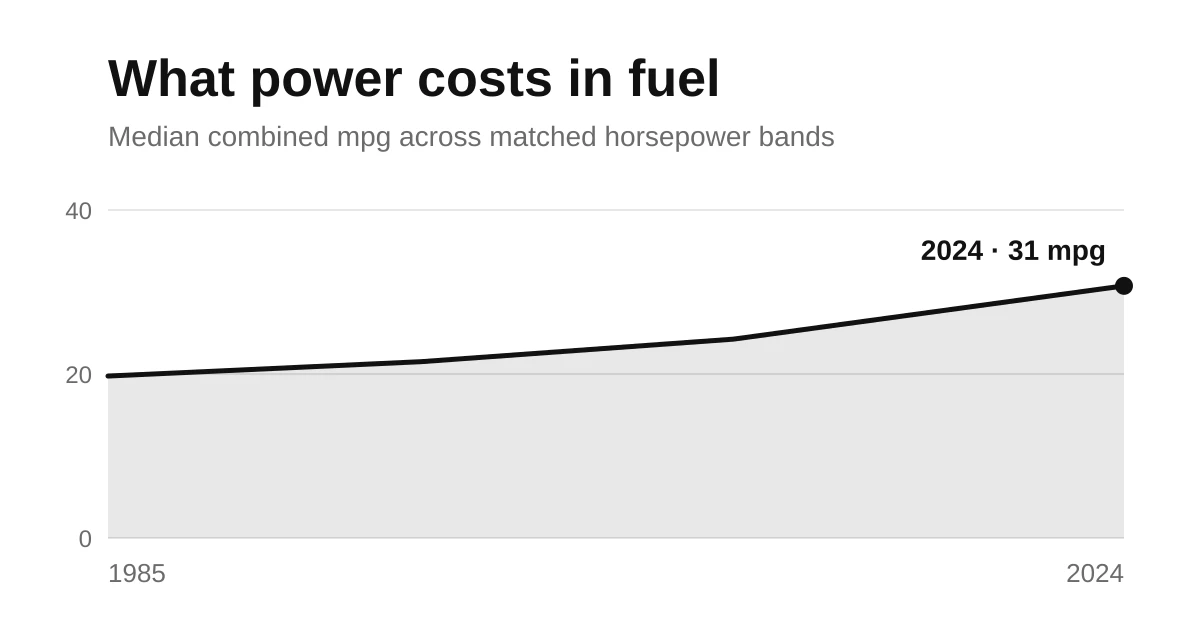
Model years 1985–2024.
The trade-off that stopped being one
For most of motoring history the deal was simple and everyone understood it: you could have speed or you could have fuel, and the exchange rate was brutal. Wanting both marked you out as the sort of person who also wants a large dinner and a flat stomach. That deal has quietly been withdrawn, and almost nobody has noticed, because the saving did not arrive as a smaller number on the forecourt — it arrived as a bigger engine that costs the same to feed.
Median combined mpg of versions offered for US sale with a petrol or diesel engine, not sales figures. Cells with fewer than 8 versions are left out. Drag to rotate, or use the arrow keys.
Each of the 5 ridges running away from you is a power band; each of the 14 steps across is three model years; the height is what that much power returned at the pump. The whole sheet lifts. Not one corner of it, not the small-engine end where you would expect the clever work to happen — all of it, including the far edge where the cars have more power than anyone sensible needs.
What the same horsepower returns now, and what it returned then
| Horsepower | Then | Now | Change | Versions then | Versions now |
|---|---|---|---|---|---|
| 50–100 | 25 | 37 | +12 | 454 | 89 |
| 100–150 | 20 | 30 | +10 | 1,291 | 798 |
| 150–200 | 17 | 28 | +11 | 987 | 2,425 |
| 200–250 | 17 | 26 | +9 | 175 | 1,709 |
| 250–300 | 14 | 22 | +8 | 31 | 3,498 |
Every band in this list returns more miles per gallon than it did at the start of this record. The biggest jump is the 50–100 hp band, which has gone from 25 mpg to 37 — 12 miles per gallon, for exactly the same power. The most stubborn is the 250–300 hp band, up 8 mpg, which is where the engineering effort has always gone into the first number rather than the second.
The mechanism is not one clever part, it is a decade of accumulated small mercies: direct injection, eight and then ten ratios instead of four, a turbocharger doing the work of two litres it does not have, stop-start, electric power steering, and the entire dark art of persuading a car to coast. None of it is romantic. All of it compounds.
There is a catch, and it is the reason this feels like a swindle even though it is not. The efficiency was real and it was mostly spent, not banked. Look at the version counts: the bands that barely existed forty years ago are now where the market lives, and the ones that were the market have emptied out. Manufacturers took the efficiency, handed the customer the same fuel bill, and gave them a hundred more horsepower and half a tonne of extra car in exchange. On the evidence of this list the customer took that deal happily, and would probably take it again.
Two things this list cannot tell you. Electric and plug-in hybrid versions are absent, because they are not measured in miles per gallon and pretending otherwise would draw a cliff in the newest years that is a change of units and not a change of engineering. And anything above 550 hp is left out: those bands hold a handful of exotics, and a median of four cars is an anecdote wearing a lab coat.
Sources
- Federal fuel-economy datasets
- EPA Automotive Trends Report, which tracks weight, power and fuel economy across the fleet
- EPA fuel-economy test procedures, including the 2008 revision
Explore the cars behind this page
The cars here are live. See everything with 300 hp that still returns 25 mpg, the 400 hp cars that kept a clutch pedal, or the most powerful petrol cars that still manage 40 mpg. Related: the year each brand gave up on breathing normally, which is how most of this was achieved, and horsepower has never been cheaper, which is the same story told in money instead of fuel.